
An SEO performance analytics dashboard is a centralized interface that displays your most critical search optimization metrics — including keyword rankings, organic traffic, click-through rates, and conversion data — in one unified view. It transforms raw data from multiple sources into visual, actionable insights. For anyone managing a website’s search presence, it’s the difference between guessing and knowing.
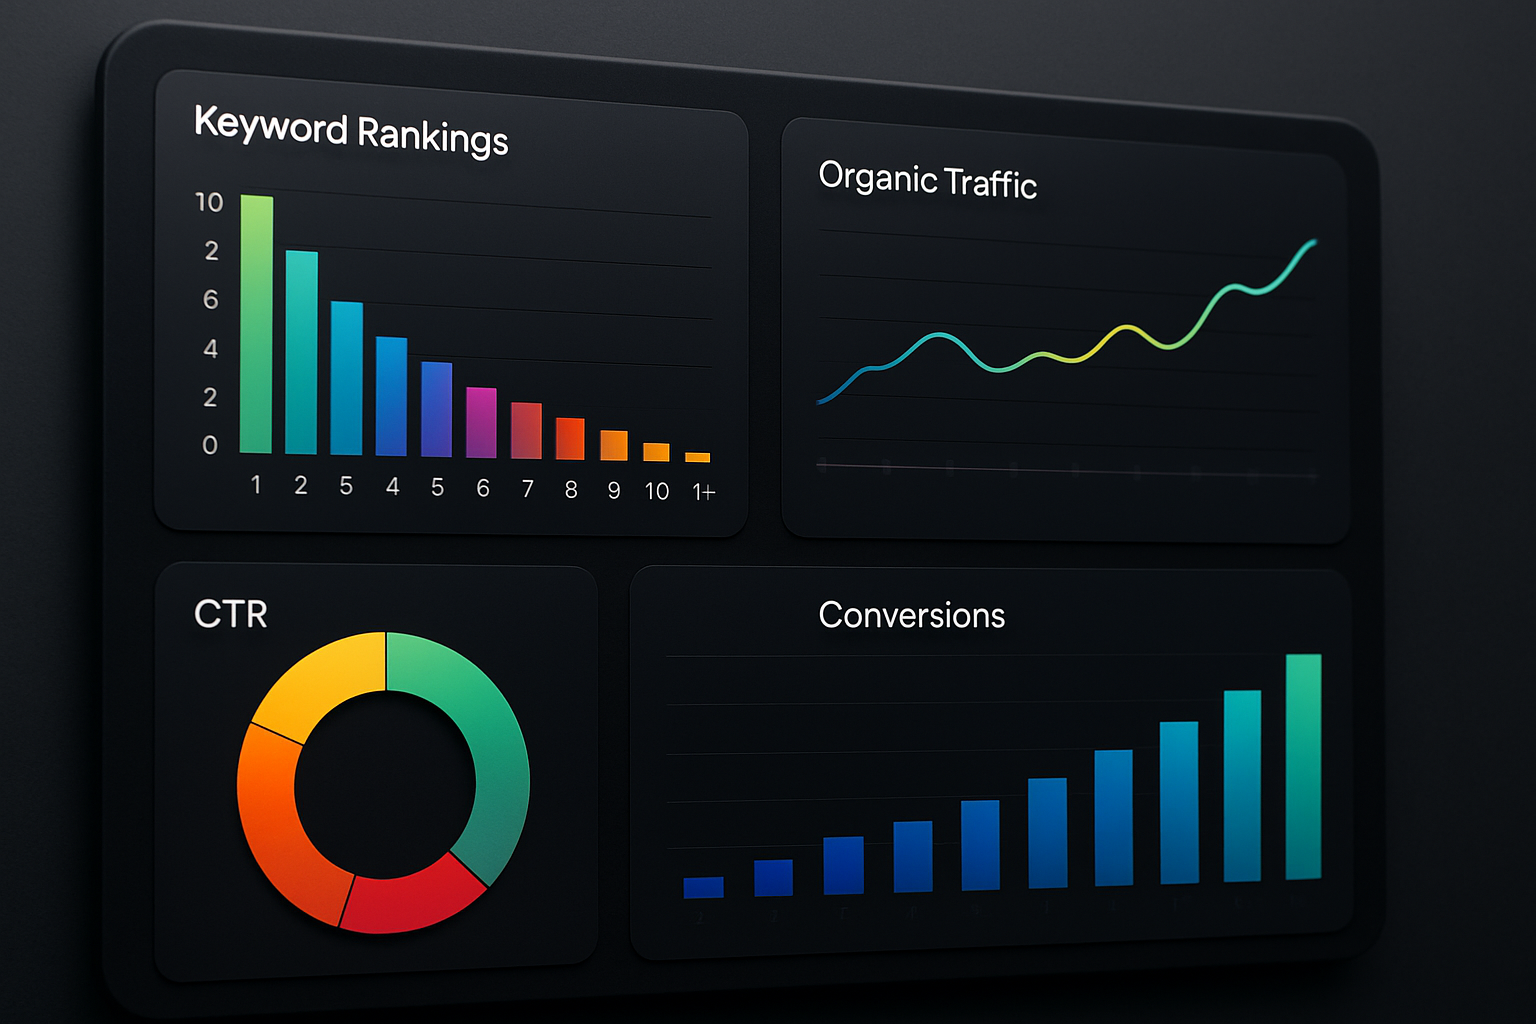
Without a reliable dashboard, SEO professionals spend hours jumping between reports, spreadsheets, and tools that don’t communicate with each other. Studies show that marketing teams using integrated analytics dashboards reduce their reporting time by up to 60%, freeing more hours for strategy and execution. That time saving compounds rapidly across weeks and months.
The best way to understand the power of an SEO analytics dashboard is to see what happens without one. Teams operating without centralized reporting often miss ranking drops, misattribute traffic sources, and fail to connect SEO efforts to real business outcomes. A well-built dashboard solves all three problems simultaneously.
What Is an SEO Performance Analytics Dashboard?
An SEO performance analytics dashboard is defined as a real-time or near-real-time visual reporting tool that aggregates data from search engines, your website’s analytics system, and other SEO data sources into a single, readable interface. It typically pulls from sources like Google Search Console, Google Analytics, and your chosen SEO platform. The goal is always the same: make complex data easy to read and act on.
These dashboards differ significantly from standard website analytics tools. While a general analytics platform might show you total traffic, an SEO dashboard breaks that traffic down by keyword, search intent, landing page, and ranking position. The level of granularity is what makes it so valuable for organic search strategy.
A strong dashboard doesn’t just display numbers — it tells a story. It shows you whether a ranking improvement actually led to more clicks, whether more clicks led to more conversions, and which pages are underperforming despite decent keyword positions. That narrative structure is what separates useful dashboards from cluttered data dumps.
Why Does Your SEO Strategy Need a Dedicated Analytics Dashboard?
SEO without analytics is like driving without a speedometer. You might be moving, but you have no idea how fast, how efficiently, or whether you’re heading in the right direction. A dedicated SEO performance analytics dashboard gives you continuous visibility into your strategy’s effectiveness.
According to a 2025 industry survey, 74% of SEO professionals said that real-time data visibility was the single biggest factor in improving their campaign decision-making. That number reflects a broader shift in how search optimization is practiced today. Speed and accuracy in reading data now directly influence competitive outcomes.
Legacy platforms and traditional SEO tools often require manual data exports and custom reports that take days to compile. Modern dashboards automate that process, delivering updated insights on demand. The difference in responsiveness can determine whether you catch a ranking drop in hours or discover it weeks later after traffic has already declined.
How Does Faster Data Access Improve SEO Outcomes?
Faster data access means faster course correction. If a core page drops five positions overnight, a dashboard alerts you before the traffic impact becomes severe. You can investigate the cause — whether it’s a technical issue, a competitor’s gain, or a content quality signal — and respond strategically.
Real-time visibility also supports better content prioritization. When you can see which keywords are within striking distance of page one, you know exactly where to focus your optimization energy for maximum return. That focus is impossible without reliable, current data.
What Key Metrics Should an SEO Analytics Dashboard Track?
Not all metrics are created equal. A well-designed SEO performance analytics dashboard prioritizes the data points that most directly connect to organic search success and business outcomes. Here are the core metrics every dashboard should display:
- Organic keyword rankings: Track position changes for your target keywords over time, segmented by page and search intent.
- Organic traffic volume: Monitor the total number of sessions arriving from unpaid search results.
- Click-through rate (CTR): CTR is defined as the percentage of users who click your search listing after seeing it in the results page. Low CTR often signals a title or meta description problem.
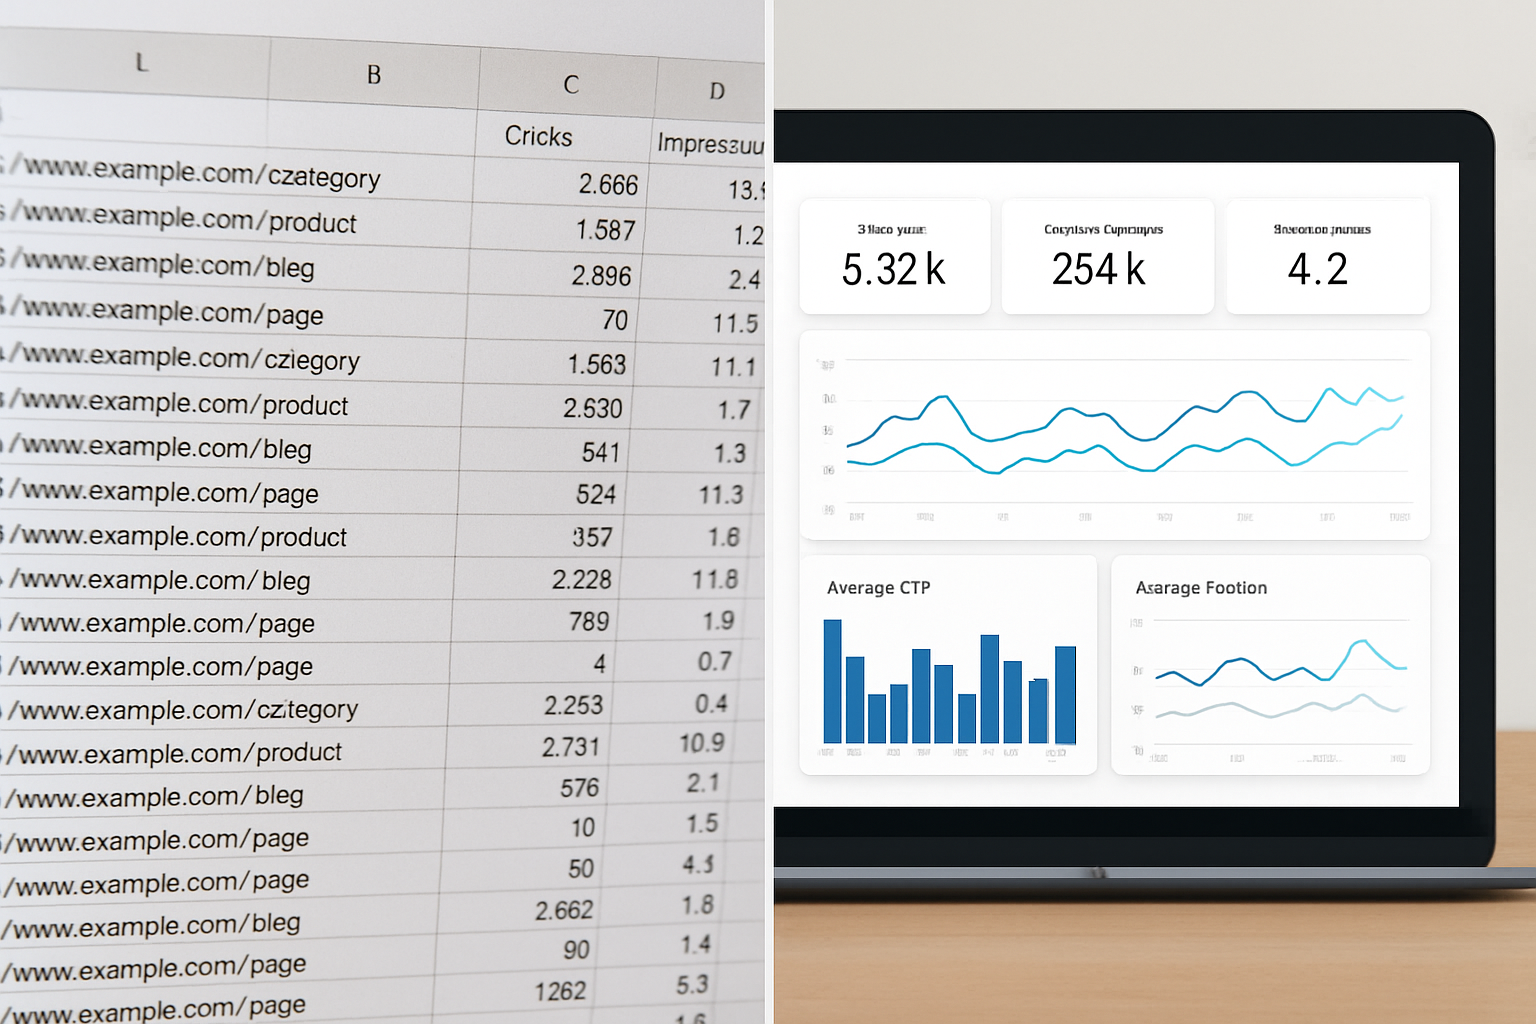
- Impressions: Impressions measure how many times your pages appear in search results, regardless of whether users click. High impressions with low CTR indicate an opportunity to optimize your snippets.
- Core Web Vitals scores: These technical performance metrics directly influence Google’s ranking decisions and should be monitored continuously.
- Backlink profile health: Track the number and quality of inbound links pointing to your site, along with any lost or toxic links.
- Conversion rate from organic traffic: Connecting SEO performance to actual revenue or leads is essential for proving and improving ROI.
- Page-level performance: See which individual pages drive the most traffic, rankings, and conversions so you can replicate what works.
The combination of these metrics gives you a complete picture of your organic search health. Tracking any one of them in isolation leads to incomplete conclusions. It’s the relationship between metrics — such as how ranking position affects CTR, which affects traffic, which affects conversions — that reveals the full story.
How Do You Set Up a High-Impact SEO Performance Dashboard?
Setting up an effective SEO performance analytics dashboard involves more than connecting data sources. It requires intentional design around the questions you need to answer most frequently. Here’s a practical framework for building or evaluating a dashboard setup:
- Define your reporting goals first. Are you tracking campaign-level performance, site-wide health, or individual page optimizations? Your goals determine which metrics sit front and center.
- Connect your primary data sources. At minimum, integrate Google Search Console for keyword and impression data, and your website analytics for traffic and conversion behavior.
- Segment your data meaningfully. Break down performance by device type, location, page category, and keyword intent to surface insights that aggregate views would hide.
- Set baseline benchmarks. Document your starting-point metrics so you can measure genuine progress rather than just tracking fluctuating numbers without context.
- Build in alerting for significant changes. A good dashboard doesn’t just report — it notifies you when something important changes, like a sudden drop in impressions or a spike in crawl errors.
- Schedule regular review cadences. Weekly check-ins for tactical adjustments and monthly deep dives for strategic decisions keep your team aligned and proactive.
- Connect SEO metrics to business KPIs. Whenever possible, tie organic traffic data to revenue, lead generation, or other bottom-line outcomes your stakeholders care about.
This framework works for solo practitioners and enterprise teams alike. The scale changes, but the principles remain consistent. A dashboard that answers the right questions for your specific business context will always outperform one that simply displays every available data point.
What Should You Avoid When Building Your Dashboard?
Metric overload is the most common dashboard mistake. Displaying fifty KPIs on one screen makes it nearly impossible to identify what actually matters at any given moment. Prioritize ruthlessly and keep your primary dashboard focused on five to eight core metrics.
Another common error is failing to update data sources regularly. Stale data in a dashboard is worse than no dashboard at all because it creates false confidence. Ensure your integrations are pulling fresh data on a schedule that matches your decision-making pace.
If you’re managing SEO for clients or a content team, you might also find value in exploring how automated SEO platforms help marketers scale organic growth without manual work — particularly when dashboard reporting needs to happen at scale across multiple properties.
How Does an SEO Dashboard Support Content Strategy?
An SEO performance analytics dashboard is not just a technical reporting tool — it’s a strategic content planning asset. By showing which topics and pages already perform well, it guides decisions about where to invest your next content creation effort. Data-driven content strategy consistently outperforms intuition-based approaches.
Research indicates that content teams using performance dashboards to inform their editorial calendars produce pages that rank in the top ten positions 2.3 times more frequently than teams that don’t use data to guide content decisions. That statistic reflects the compounding advantage of building content around confirmed opportunity signals. You can learn more about using smart tools to accelerate this process in this guide on how to create high-ranking content faster and smarter with an SEO content generation tool.
Dashboard data also reveals content decay — the gradual loss of ranking and traffic that affects even well-optimized pages over time. Without visibility into page-level performance trends, content decay goes unnoticed until traffic losses become significant. A good dashboard surfaces these trends early so you can refresh content before rankings slip further.
How Does an SEO Dashboard Help Identify Quick Wins?
A quick win in SEO is defined as a ranking or traffic improvement achievable with relatively low effort in a short time frame, typically by optimizing existing content rather than building new pages from scratch. Dashboards surface these opportunities by highlighting pages ranking in positions four through fifteen, where modest improvements can deliver meaningful traffic gains.
Filtering your keyword data by impressions-versus-clicks ratio is another powerful dashboard technique for finding quick wins. Pages with high impressions but low CTR are already visible in search results — they just need better titles, descriptions, or structured data to convert those impressions into traffic.
Why Should Agencies and Growing Teams Use an Integrated SEO Dashboard?
For agencies managing multiple clients, a fragmented reporting setup is a serious operational liability. An integrated SEO performance analytics dashboard that handles multiple properties under one roof dramatically reduces reporting overhead and improves the consistency of insights delivered to clients. If you’re evaluating platforms at the agency level, the criteria for choosing wisely matter enormously — and our guide on how to choose the right AI SEO platform for your agency covers the key factors in depth.
Consistency is critical when reporting to clients or internal stakeholders. A dashboard that automatically generates standardized reports eliminates the risk of human error in manual reporting and ensures every client receives the same quality of data presentation. That consistency builds trust over time.
Growing in-house teams benefit equally from integrated dashboards. As your website scales from dozens of pages to hundreds or thousands, manual tracking becomes untenable. An automated, centralized dashboard scales with your content operation without adding proportional reporting labor.
How Is AI Changing the Way SEO Dashboards Work?
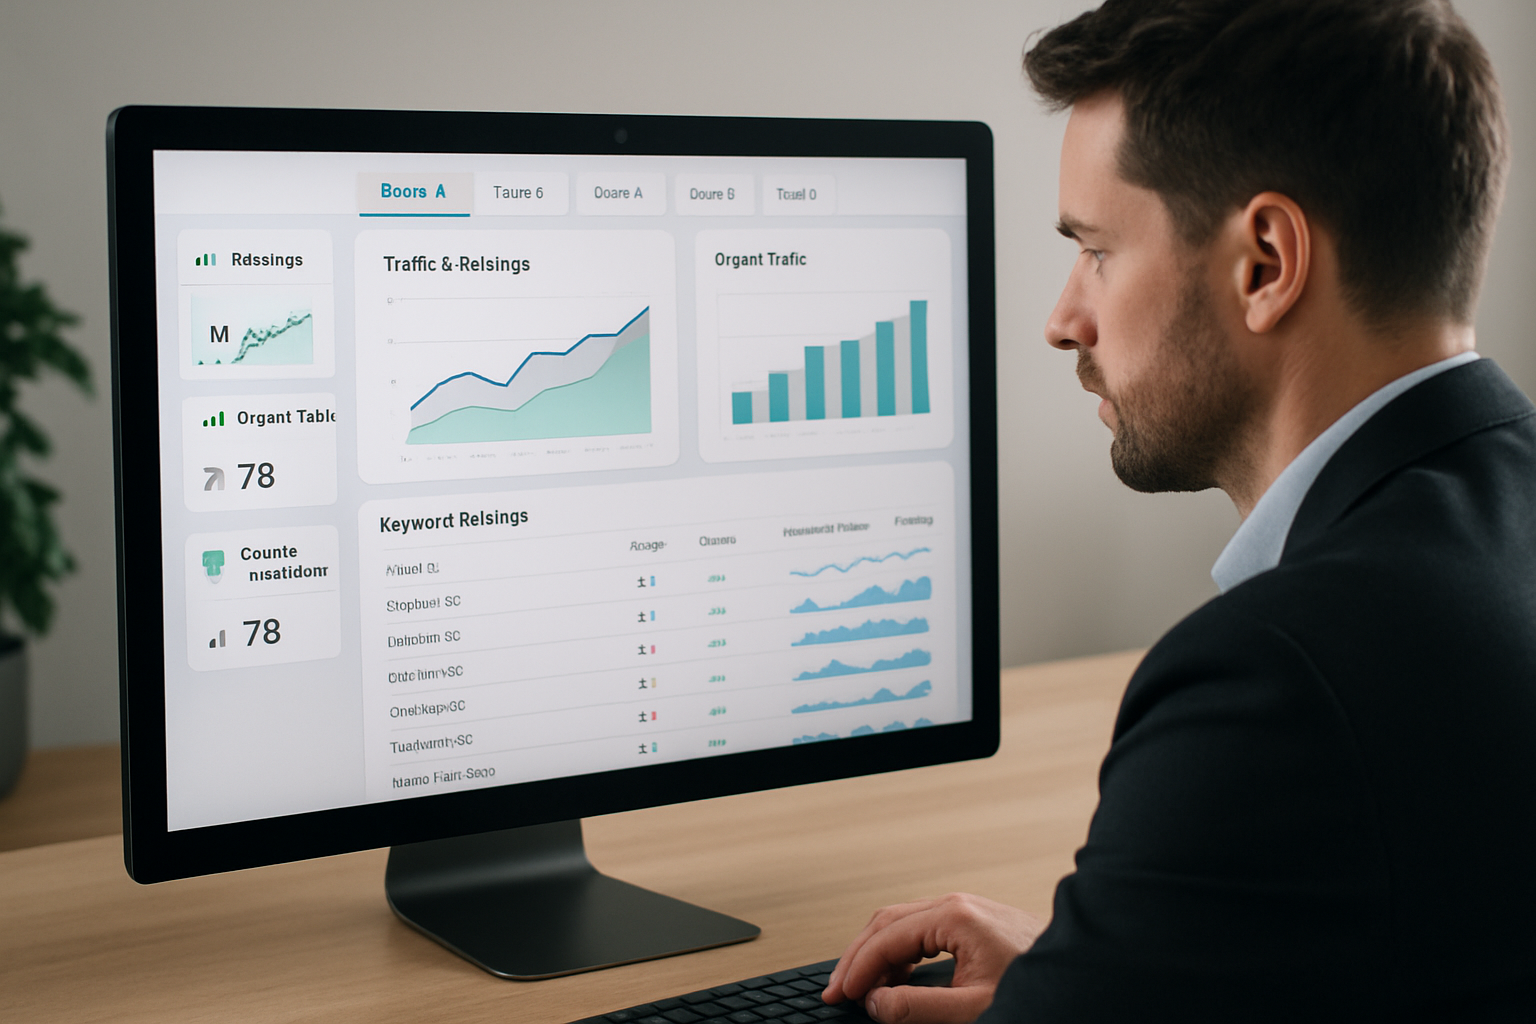
Artificial intelligence is transforming SEO dashboards from passive reporting tools into proactive strategy assistants. Modern AI-powered dashboards don’t just display data — they analyze patterns, predict trends, and surface recommendations based on your specific site’s history and competitive landscape. This shift is redefining what it means to “monitor” SEO performance.
AI-driven anomaly detection is one of the most impactful advances. Instead of manually reviewing charts to spot irregularities, AI identifies statistically significant changes and flags them with context — for example, alerting you that a ranking drop correlates with a Google algorithm update or a competitor publishing a stronger piece of content on the same topic.
Natural language query capabilities are also emerging in leading dashboard platforms. You can ask questions like “Which pages lost the most traffic this month?” or “What keywords are closest to reaching position one?” and receive instant, data-backed answers without building a custom report. This makes advanced analytics accessible to team members who aren’t data specialists.
What Makes RankBloom SEO’s Dashboard Approach Different?
RankBloom SEO is built around the principle that SEO data should be instantly understandable and immediately actionable — not buried in export files or locked behind complex manual reporting workflows. Its performance analytics features are designed to give marketers, content teams, and agencies a clear view of what’s working and what needs attention right now.
Rather than overwhelming users with every possible metric, RankBloom SEO surfaces the insights that are most relevant to your current goals and growth stage. The platform combines automated data aggregation with AI-driven recommendations, so your dashboard doesn’t just show you numbers — it tells you what to do next. That intelligent layer is what separates it from legacy platforms that simply collect and display data without interpretation.
For businesses at any stage of their SEO journey, RankBloom SEO provides a scalable, modern alternative to the patchwork of traditional tools that most teams currently rely on. Its unified approach to performance analytics means you spend less time managing data and more time driving results.
Frequently Asked Questions
What is an SEO performance analytics dashboard?
An SEO performance analytics dashboard is a centralized reporting tool that displays key search optimization metrics — including keyword rankings, organic traffic, CTR, and conversions — in one visual interface. It connects data from sources like Google Search Console and your website analytics to give you a complete, real-time view of your search performance.
Which metrics are most important to track in an SEO dashboard?
The most critical metrics to track are keyword ranking positions, organic traffic volume, click-through rate, impressions, Core Web Vitals scores, backlink profile health, and conversion rate from organic traffic. Together, these metrics paint a complete picture of your SEO health and ROI.
How often should I review my SEO analytics dashboard?
A weekly review is recommended for tactical monitoring — checking for ranking changes, traffic anomalies, and technical issues. A monthly deep-dive review is better suited for strategic analysis, content planning, and progress assessment against longer-term goals.
Can a small business benefit from an SEO performance analytics dashboard?
Yes, absolutely. Small businesses benefit significantly from dashboards because they reveal exactly where to focus limited time and resources for maximum organic growth. Even a basic dashboard showing keyword rankings and organic traffic trends can dramatically improve a small business’s SEO decision-making.
What is the difference between an SEO dashboard and standard website analytics?
Standard website analytics shows overall traffic data, while an SEO performance analytics dashboard specifically focuses on organic search — breaking traffic down by keyword, ranking position, search intent, and page-level performance. An SEO dashboard is purpose-built to improve and monitor your search visibility strategy, not just measure general site activity.
Conclusion: Turn Your SEO Data Into a Competitive Advantage
An SEO performance analytics dashboard is no longer a luxury reserved for enterprise teams with large budgets and dedicated data analysts. It’s a fundamental tool for any business or marketer serious about growing organic search presence with clarity, speed, and confidence. The teams winning in search today are the ones who can see their data clearly, interpret it quickly, and act on it decisively.
The shift from fragmented, manual reporting to integrated, intelligent dashboards is one of the most impactful operational improvements an SEO team can make. It reduces wasted time, surfaces opportunities faster, and connects search performance directly to the business outcomes that matter most. Every hour saved on reporting is an hour redirected toward the work that actually moves rankings.
If you’re ready to replace reactive guesswork with proactive, data-driven SEO strategy, RankBloom SEO offers the modern, AI-powered analytics experience your team deserves. Explore the platform today and discover what it feels like to have your most important SEO performance data working for you — not against you.