
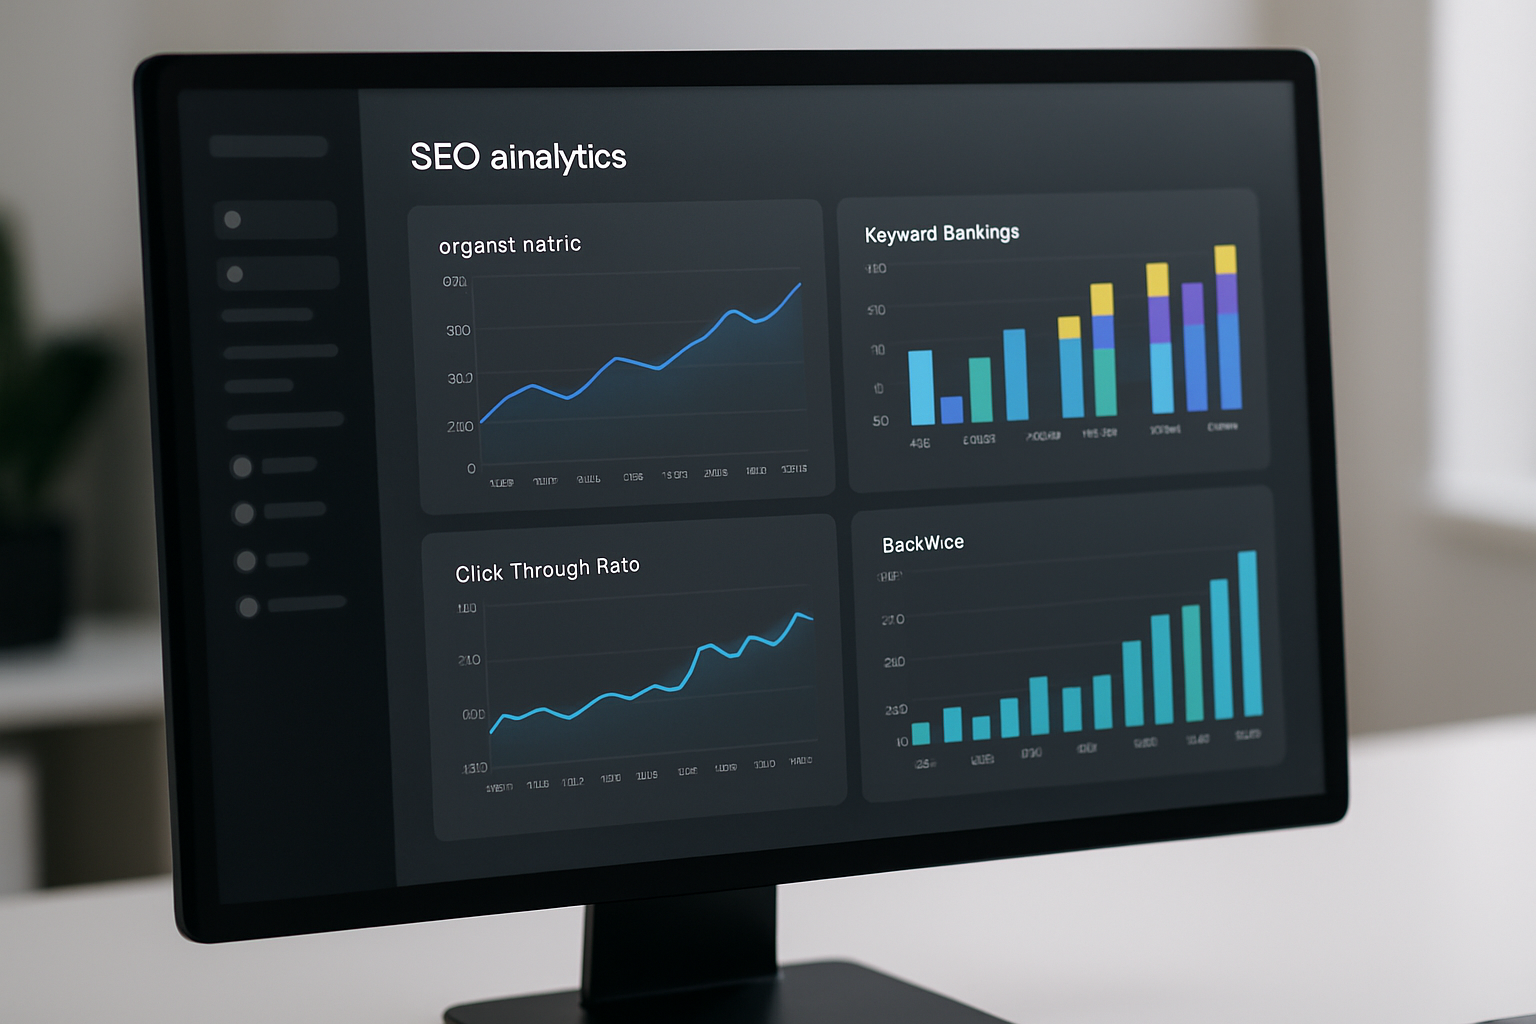
An SEO analytics dashboard is a centralized interface that collects, displays, and organizes your website’s most important search performance metrics in real time. It brings together data from multiple sources — rankings, organic traffic, backlinks, and conversions — so you can make faster, smarter decisions. Without one, you are left toggling between disconnected tools and missing the big picture entirely.
Studies show that marketers who use centralized analytics dashboards are 23% more likely to report year-over-year SEO improvement compared to those relying on standalone tools. The ability to see all your data in one view removes friction from the decision-making process. When insights are easy to find, action happens faster.
This guide walks you through everything you need to know about building and using an SEO analytics dashboard effectively. Whether you are a solo blogger, an in-house SEO professional, or an agency managing multiple clients, the principles here apply directly to your workflow. By the end, you will know exactly what to track and why.
What Is an SEO Analytics Dashboard and Why Does It Matter?
An SEO analytics dashboard is defined as a visual reporting tool that aggregates data from search engines, web analytics platforms, and third-party SEO tools into a single, readable interface. It eliminates the need to log into five different platforms to understand how your site is performing. Think of it as your command center for organic search strategy.
The dashboard matters because raw SEO data without context is nearly useless. Seeing that your traffic dropped 15% means nothing unless you can also see which keywords fell, which pages lost impressions, and when the change happened. A well-built SEO analytics dashboard connects those dots automatically.
Without this kind of overview, teams often react to symptoms rather than root causes. A dashboard turns reactive SEO into proactive SEO, which is where real growth happens. It is one of the highest-leverage investments you can make in your organic search strategy.
What Key Metrics Should Every SEO Analytics Dashboard Include?
The best SEO analytics dashboard includes a core set of metrics that together tell the full story of your organic search health. These metrics span visibility, engagement, authority, and conversion. Leaving any one category out creates blind spots in your strategy.
Here are the essential metric categories and specific data points to include:
- Visibility Metrics: Keyword rankings by position, keyword position changes over time, and search impressions from Google Search Console
- Traffic Metrics: Organic sessions, organic users, new vs. returning organic visitors, and landing page performance
- Engagement Metrics: Click-through rate (CTR), average session duration, pages per session, and bounce rate from organic traffic
- Authority Metrics: Domain authority score, total backlinks, referring domains, and toxic backlink alerts
- Conversion Metrics: Organic goal completions, e-commerce revenue from organic traffic, and assisted conversions
- Technical Health Metrics: Core Web Vitals scores, crawl errors, index coverage, and page speed data
Click-through rate (CTR) is defined as the percentage of users who click on your search result after seeing it in the search engine results page (SERP). A low CTR means your title tags and meta descriptions may need optimization even if your rankings are strong. Monitoring CTR in your SEO analytics dashboard reveals hidden opportunities without requiring any additional keyword research.
Domain authority is defined as a third-party score (typically from Moz, Ahrefs, or Semrush) that predicts how likely a website is to rank well in search engines based on its backlink profile. It is not a Google metric, but it is a useful proxy for measuring your site’s overall link health. Tracking it monthly inside your dashboard helps you measure the long-term impact of link-building campaigns.
How Does an SEO Analytics Dashboard Actually Work?
An SEO analytics dashboard works by pulling data through API connections from multiple platforms and displaying it inside a unified reporting interface. The most common data sources include Google Search Console, Google Analytics 4, Ahrefs, Semrush, Moz, and Screaming Frog. These connections refresh automatically, so your data stays current without manual exports.
The workflow typically looks like this:
- Connect your data sources — Link your Google Search Console and GA4 accounts to your dashboard platform via authorized API integrations
- Set your tracking parameters — Define which keywords, pages, locations, and devices you want to monitor
- Configure your metrics panels — Choose which charts, tables, and KPI cards appear on each section of the dashboard
- Set automated alerts — Configure notifications for significant traffic drops, ranking changes, or crawl errors
- Schedule reports — Set up automatic weekly or monthly PDF or email reports for stakeholders
- Review and act — Use the dashboard regularly to identify trends and prioritize your SEO workload
Most modern SEO analytics dashboard platforms now include AI-generated insights that flag anomalies automatically. For example, if your top-performing page loses 40% of its impressions overnight, the system alerts you before it becomes a serious problem. This kind of proactive monitoring used to require hours of manual data analysis.
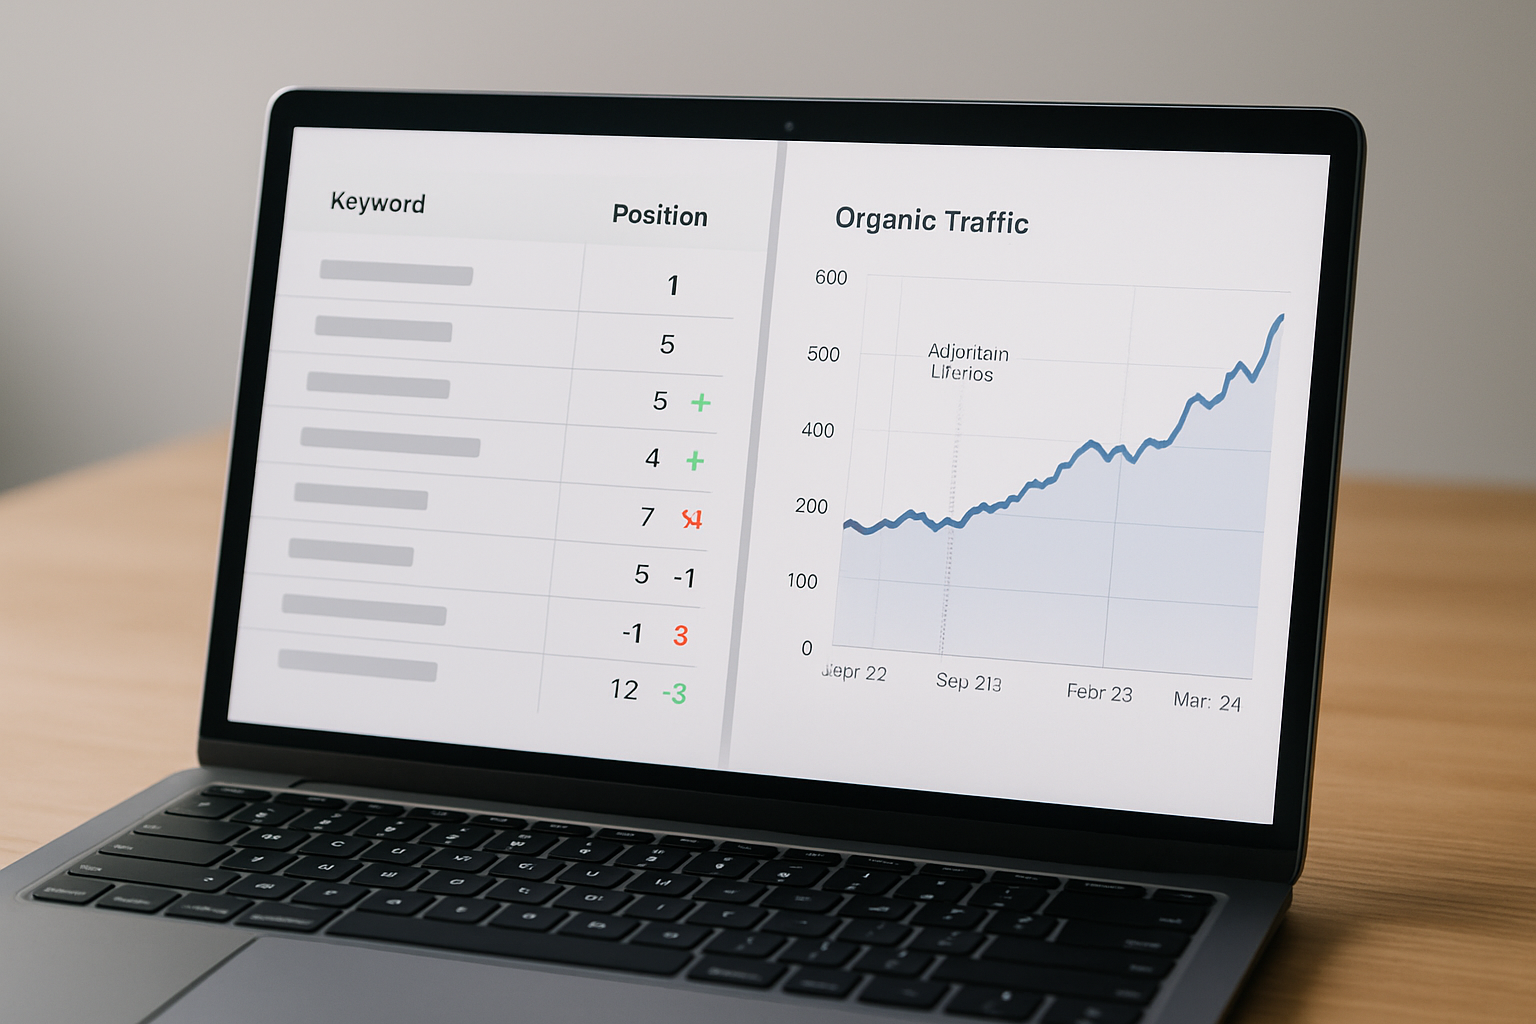
Which Platforms Are Best for Building an SEO Analytics Dashboard?
The best platforms for building an SEO analytics dashboard in 2026 depend on your budget, technical skill level, and reporting needs. There is no single right answer, but some platforms consistently outperform others for specific use cases. Here is a breakdown of the top options:
- Google Looker Studio (free): Best for agencies and teams already using Google tools. Highly customizable, connects directly to GA4 and Search Console, and supports multi-client reporting with shared templates.
- Semrush: Best for all-in-one SEO management. Its built-in dashboard combines keyword tracking, site audits, backlink monitoring, and competitor analysis with minimal setup required.
- Ahrefs: Best for backlink and content gap analysis. Its dashboard excels at authority and competitive intelligence reporting, especially for content-heavy SEO strategies.
- Databox: Best for cross-platform visualization. It integrates with over 100 data sources and lets you build custom SEO dashboards without writing code.
- AgencyAnalytics: Best for client reporting. Purpose-built for SEO agencies, it automates white-label reporting and supports over 80 integrations in a clean interface.
- Power BI / Tableau: Best for enterprise-level reporting. These business intelligence tools handle massive datasets and allow deeply custom SEO analytics dashboards at scale.
According to a 2025 survey by Search Engine Journal, 61% of SEO professionals use Google Looker Studio as their primary reporting tool, making it the most widely adopted option in the industry. Its zero cost and deep Google integration make it the default starting point for most teams. However, its learning curve is steeper than plug-and-play tools like AgencyAnalytics.
How Do You Build an Effective SEO Analytics Dashboard From Scratch?
The best way to build an effective SEO analytics dashboard is to start with your business goals, not your available data. Too many dashboards are built by pulling in every available metric, which creates noise rather than clarity. Start by asking: what decisions does this dashboard need to help me make?
Follow this structured process to build a dashboard that actually gets used:
- Define your audience — Are you building for yourself, your team, or a client? Each audience needs different levels of detail and different metrics prioritized.
- List your top three SEO goals — Examples include growing organic traffic by 30%, improving average position for target keywords, or reducing crawl errors below 50.
- Map metrics to goals — For each goal, identify the two or three metrics that most directly measure progress toward it.
- Choose your data sources — Connect only the platforms that feed your mapped metrics. Avoid connecting sources just because you can.
- Design for scanning, not reading — Use color coding, sparklines, trend arrows, and summary KPI cards at the top so users can assess status in under 10 seconds.
- Test and iterate — Share the dashboard with its intended audience, gather feedback after two weeks, and refine the layout based on how people actually use it.
Research by Nielsen Norman Group found that dashboards are abandoned when they contain more than seven to nine distinct data panels on a single screen. Keeping your SEO analytics dashboard focused and scannable dramatically increases how often it gets used. A dashboard that nobody looks at adds no value, no matter how much data it contains.
Why Should SEO Teams Prioritize Dashboard Customization?
X is not a one-size-fits-all solution — SEO analytics dashboard customization is critical because different businesses have radically different goals, audiences, and competitive landscapes. An e-commerce brand tracking product page rankings needs a completely different view than a SaaS company monitoring trial signups from organic blog content. Generic dashboards force teams to mentally filter irrelevant data on every visit, which slows decision-making.
Customization also enables segment-level reporting, which is where the most actionable insights typically live. For example, separating branded from non-branded organic traffic in your dashboard reveals whether your SEO growth is driven by demand you already own or demand you are actively capturing. That distinction changes strategy entirely.
Studies show that teams with customized reporting dashboards spend 37% less time on routine reporting tasks, freeing that time for actual optimization work. When your SEO analytics dashboard shows only what matters to your specific goals, every session with it produces a clear next action. That efficiency compounds significantly over time.
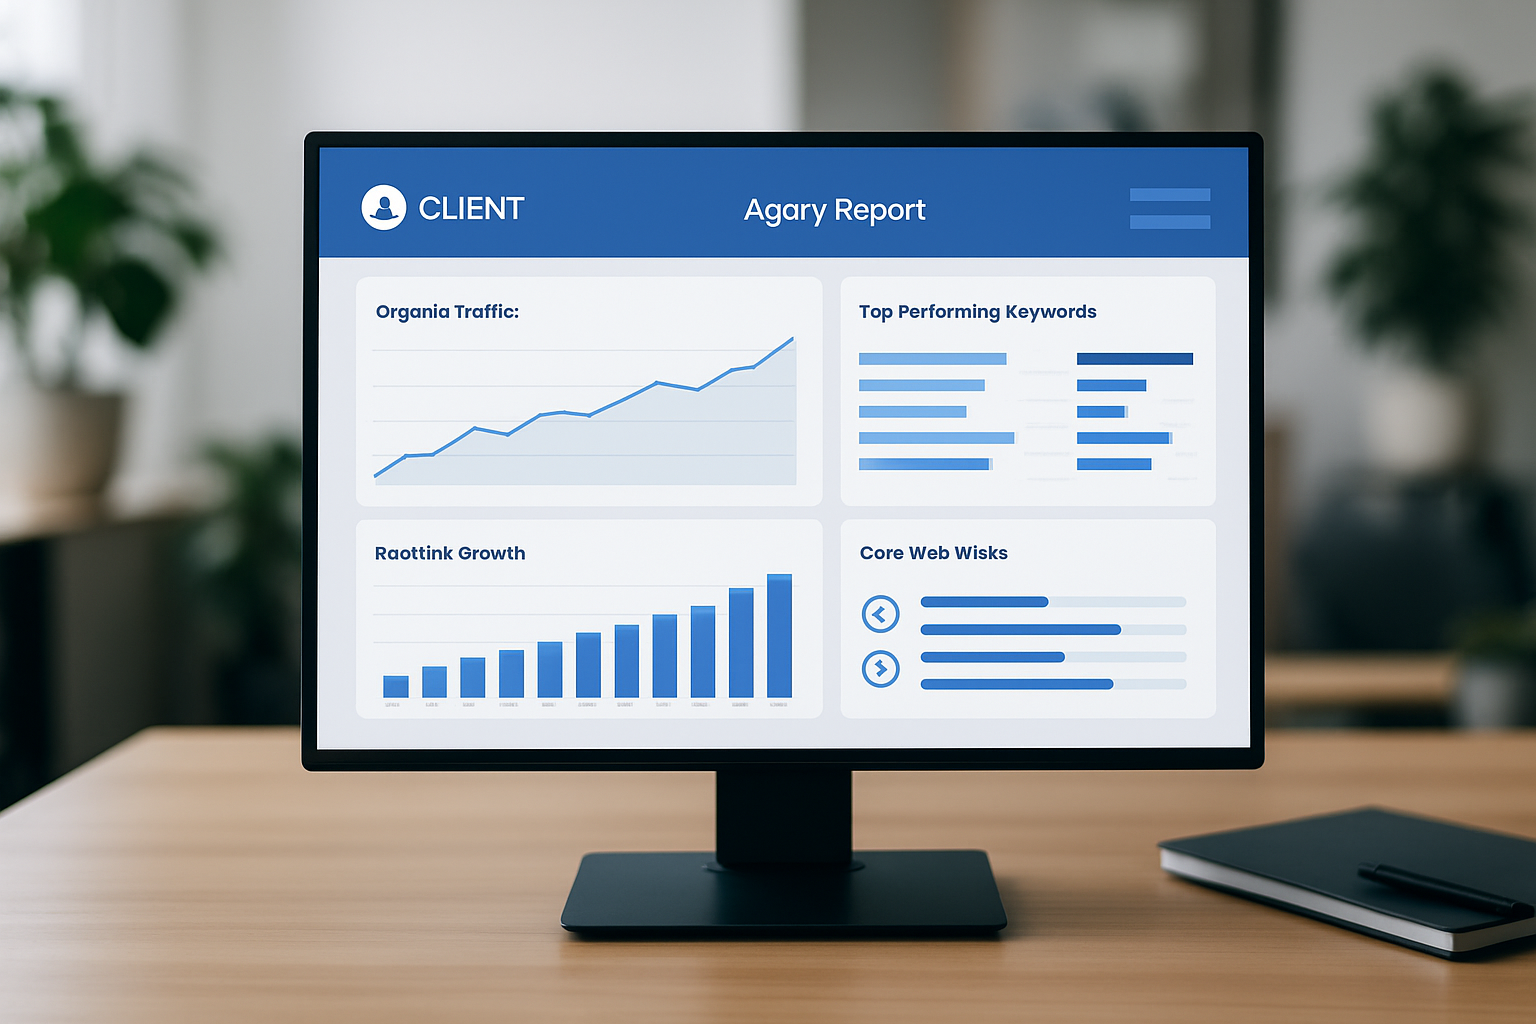
How Do You Interpret SEO Dashboard Data to Drive Real Results?
Interpreting SEO analytics dashboard data effectively requires you to look for patterns and anomalies rather than just snapshot numbers. A single week of traffic data tells you almost nothing. Three months of trend data tells you whether your strategy is working.
Use these interpretation principles to get more value from your dashboard:
- Compare periods, not just dates — Always compare current performance to the same period last year to account for seasonality
- Segment by intent — Separate informational, navigational, and transactional keyword groups to understand which intent types are growing
- Correlate events with changes — Annotate your traffic graph with content publication dates, algorithm update dates, and technical changes to identify cause and effect
- Focus on directional trends — A metric moving consistently in one direction over 90 days is far more meaningful than a single spike or dip
- Cross-reference metrics — Rising impressions with flat clicks signals a CTR problem; rising clicks with flat conversions signals a landing page problem
Google releases several major and minor algorithm updates each year, and these often cause visible shifts in your SEO analytics dashboard data. Keeping a log of update dates allows you to distinguish between changes caused by your own actions and changes caused by Google’s ranking systems. Without that context, you risk optimizing for the wrong thing.
What Are Common SEO Analytics Dashboard Mistakes to Avoid?
The most common SEO analytics dashboard mistakes involve tracking vanity metrics instead of outcome metrics, building dashboards that are too complex to use, and failing to connect SEO data to business revenue. These mistakes make dashboards decorative rather than functional. Avoiding them from the start saves enormous time and energy.
Specifically, watch out for these pitfalls:
- Tracking raw impressions without monitoring CTR or clicks
- Reporting domain authority as a primary KPI without connecting it to traffic or rankings movement
- Building a dashboard and never revisiting its structure as your SEO goals evolve
- Ignoring mobile vs. desktop segmentation when your audience is predominantly mobile
- Failing to filter out bot traffic, internal team traffic, and spam referrals that inflate your organic session numbers
- Not aligning your dashboard reporting cadence with your actual decision-making cycle
One particularly costly mistake is treating your SEO analytics dashboard as a reporting tool rather than a decision-making tool. Reports tell you what happened. Decisions change what happens next. Frame every metric in your dashboard around a question it helps you answer, and your dashboard becomes dramatically more valuable.
Frequently Asked Questions
What is the best free SEO analytics dashboard tool available today?
Google Looker Studio is the best free SEO analytics dashboard tool, offering direct integration with Google Search Console and GA4, unlimited reports, and shareable templates at no cost.
How often should I review my SEO analytics dashboard?
You should review your SEO analytics dashboard at least once a week for traffic and ranking trends, and conduct a deeper monthly review to assess progress toward your quarterly SEO goals.
Can I use an SEO analytics dashboard to track competitor performance?
Yes, platforms like Semrush and Ahrefs allow you to add competitor domains to your dashboard and track their keyword rankings, backlink growth, and organic traffic estimates alongside your own data.
How many keywords should I track in my SEO analytics dashboard?
Most SEO professionals recommend tracking between 50 and 200 target keywords in your dashboard, focusing on keywords that are directly tied to your business goals rather than tracking every possible search term.
Do I need technical skills to set up an SEO analytics dashboard?
You do not need coding skills to set up most modern SEO analytics dashboards — tools like AgencyAnalytics, Databox, and Semrush use drag-and-drop interfaces, though Google Looker Studio requires some familiarity with data connectors and formula-based metrics.
Start Using Your SEO Analytics Dashboard to Grow Smarter
An SEO analytics dashboard is not a luxury for large teams — it is a foundational tool for anyone serious about growing organic search performance efficiently. It brings clarity to complex data, aligns your team around shared goals, and turns reactive fire-fighting into proactive strategy. The ROI of building one well is enormous compared to the cost of flying blind.
Start simple. Connect Google Search Console and GA4 to Looker Studio, add your top 10 target keywords, and build a single-page view of your most important metrics. Iterate from there as your needs grow. The perfect dashboard built over time beats the perfect dashboard never launched.
Ready to take control of your organic search performance? Audit your current reporting setup this week, identify the three metrics most tied to your business goals, and build your first SEO analytics dashboard around them. If you need help choosing the right platform or designing a dashboard structure that matches your specific goals, reach out — better data leads to better decisions, every single time.